
To understand crypto price charts, look at the overall trend—find out if prices are moving up, down, or sideways. Use candlestick patterns to spot market sentiment and potential reversals. Check different timeframes to get a clearer picture of short-term and long-term movements. Confirm your observations with volume and other indicators. Practicing these steps helps you make smarter decisions; keep exploring to master the details.
Key Takeaways
- Start by identifying the overall trend: uptrend, downtrend, or sideways movement.
- Learn to read candlestick patterns to gauge market sentiment and potential reversals.
- Use multiple timeframes to analyze short-term and long-term price movements for better context.
- Confirm trends with volume and other indicators to strengthen your trading signals.
- Practice combining trend analysis with candlestick patterns for more accurate decision-making.
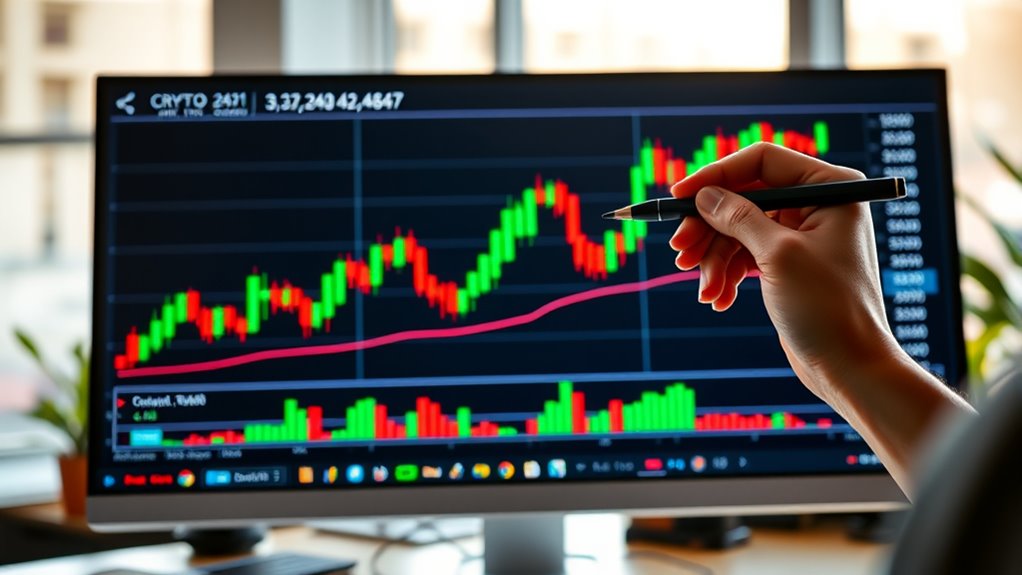
Understanding how to read crypto price charts is essential for making informed investment decisions. When you start analyzing charts, you’ll quickly see that recognizing trends and patterns can give you a significant edge. Trend analysis helps you identify whether a cryptocurrency is moving upward, downward, or sideways. By observing the direction of price movements over different timeframes, you can determine if it’s a good time to buy, sell, or hold. For instance, a clear uptrend suggests increasing buying interest, while a downtrend might indicate selling pressure. Recognizing these trends early allows you to align your trades with the overall market momentum, reducing the risk of reacting to short-term fluctuations.
Candlestick patterns are another critical element in reading crypto charts. These patterns are visual representations of price movements within a specific period and can reveal market sentiment. Each candlestick displays the open, high, low, and close prices, giving you a snapshot of what traders are doing. For beginners, learning to interpret basic candlestick formations like doji, hammer, shooting star, or engulfing candles can provide valuable clues about potential reversals or continuations of the trend. For example, a hammer after a downtrend might signal a potential reversal to the upside, while an engulfing pattern could confirm a trend change. Paying attention to these patterns helps you anticipate market moves before they fully develop, giving you more confidence in your trading decisions.
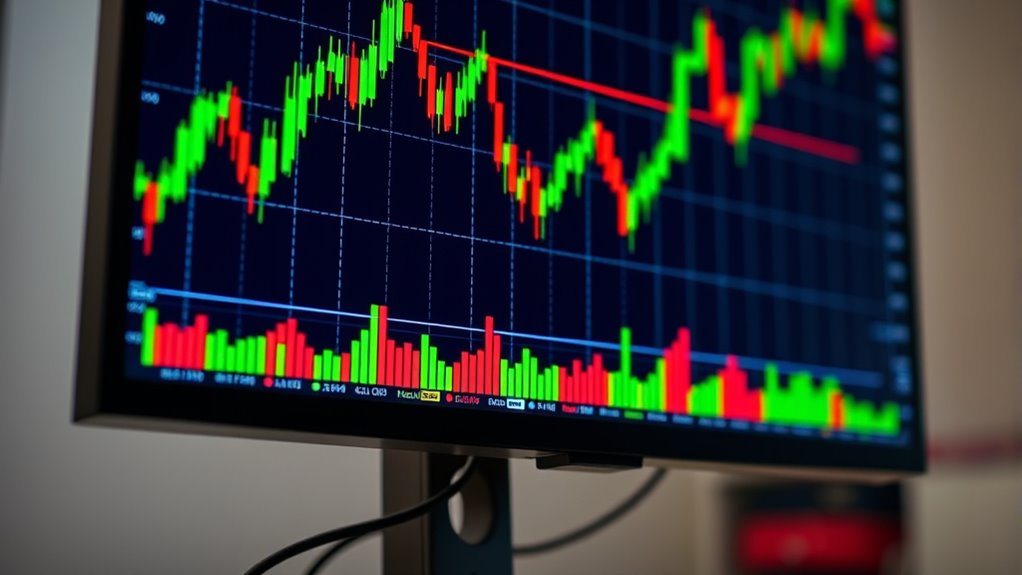
As you analyze charts, you’ll notice that combining trend analysis with candlestick patterns offers a powerful approach. When a trend aligns with a strong candlestick signal, it strengthens your conviction about the market direction. Conversely, conflicting signals might prompt you to wait or reassess your strategy. Remember, charts are not foolproof, but the more you practice reading them, the better you’ll become at spotting reliable signals. Use different timeframes—from minutes to days—to get an in-depth view of the market, and always consider volume and other indicators to confirm your observations. By mastering trend analysis and candlestick patterns, you’ll gain a clearer understanding of market behavior, helping you make smarter, more informed crypto investments.

Bitkey Bitcoin Hardware Wallet - Secure Wallet for Self Custody, No Seed Phrase, 2-of-3 Multisig Security, NFC Device, iOS and Android Compatible
- Self Custody Bitcoin Wallet: Secure your bitcoin independently
- No Seed Phrase Needed: Reduces risk of loss or theft
- Multisig Security (2-of-3): Multiple approvals for transactions
As an affiliate, we earn on qualifying purchases.
Frequently Asked Questions
What Are the Best Tools for Analyzing Crypto Charts?
You should use tools like TradingView or Coinigy, as they offer thorough analysis of crypto charts. These platforms provide essential features such as technical indicators and chart patterns, helping you identify market trends. With customizable options, you can analyze price movements more effectively. They also support real-time data, so you stay updated. Overall, these tools empower you to make informed trading decisions by understanding key chart signals.
How Do I Identify Trends in Crypto Price Charts?
To catch trends early, keep your eye on trend recognition and pattern identification. You should look for higher highs and higher lows for an uptrend or lower lows and lower highs for a downtrend. Use moving averages and trendlines to confirm these patterns. Remember, spotting the signals early helps you stay ahead of the curve, as catching a trend before it runs its course can make all the difference.
What Are Common Mistakes Beginners Make When Reading Charts?
You might fall into common mistakes like chart misinterpretations or relying too heavily on indicators. Don’t assume every pattern predicts future moves; charts can be misleading. Overusing indicators can cause confusion instead of clarity. Stay focused on price action and volume. Remember, no single chart or indicator guarantees success—combine multiple tools and always analyze context to make smarter trading decisions instead of jumping to conclusions.
How Can Volume Data Improve My Chart Analysis?
Volume data can revolutionize your chart analysis, making it feel like you’ve unbolted a secret weapon. By paying attention to volume indicators and trade volume, you get a clearer picture of market strength behind price movements. High volume often signals strong buying or selling pressure, confirming trends or warning of reversals. Ignoring this data is like trying to navigate a storm blindfolded—volume helps you see the true direction and make smarter trades.
What Are Some Reliable Sources for Real-Time Crypto Charts?
You can find reliable real-time crypto charts on popular cryptocurrency exchanges like Binance, Coinbase, and Kraken, which offer detailed and up-to-date data. Additionally, charting platforms such as TradingView and Coinigy provide advanced tools and customizable options for tracking prices live. These sources guarantee you get accurate, timely information to make informed trading decisions, helping you stay ahead in the fast-moving crypto market.
New iPollo V2H Hydro Miner 3400MH/s 475W ETC Ethereum Classic ETHW ETHF ZIL Octa with HYD Water Cooling Super with Original PSU and Cord Quiet Home Mining by OEMGMINER (iPollo V2H 3400M)
- High Hash Rate: 3400MH/s for efficient mining
- Low Power Consumption: 475W for energy savings
- Supports Multiple Cryptos: ETC, ETHW, ETHF, ZIL, and more
As an affiliate, we earn on qualifying purchases.
Conclusion
Now that you know how to read crypto price charts, you can confidently navigate the digital marketplace. Picture yourself standing at a busy trading station, your eyes scanning the colorful candlesticks and trend lines like a seasoned trader. With each glance, the charts whisper secrets of market movements, guiding your next move. Keep practicing, and soon you’ll read these charts as easily as following a map—turning data into decisions with clarity and confidence.

Bitcoin: Beginners Bible - How You Can Profit from Trading and Investing in Bitcoin (Bitcoin, Cryptocurrency and Blockchain Book 3)
As an affiliate, we earn on qualifying purchases.

Crypto Trading for Ambitious Beginners: A Practical Guide to Profitable Trading in Bitcoin and other Cryptocurrencies
As an affiliate, we earn on qualifying purchases.