

To build a better crypto research workflow, you should start by following reputable sources and setting up alerts for major updates. Organize data systematically and track key metrics like price, volume, and market cap. Use both technical and fundamental analysis, and visualize data with charts or heatmaps to identify patterns quickly. Automate repetitive tasks and dedicate routine times for updates. Keep refining your process for faster, smarter decisions—more tips on optimizing your workflow are waiting for you.
Key Takeaways
- Integrate credible data sources and set alerts for timely updates on market shifts.
- Combine technical and fundamental analysis for a comprehensive market perspective.
- Use visualizations like charts and heatmaps to quickly identify patterns and signals.
- Establish a disciplined routine with scheduled data review, automation, and workflow adjustments.
- Focus on rapid data interpretation to make informed, timely trading decisions.
In the fast-paced world of cryptocurrency, developing a streamlined research workflow is essential to stay ahead. Staying informed requires a clear process for gathering, analyzing, and interpreting data. Your goal should be to make informed decisions quickly, which means honing your approach to market analysis and data visualization. The first step is to identify reliable sources of information. Follow reputable news outlets, official project channels, and industry reports. Set up alerts for major updates to avoid missing critical shifts in the market. Once you have your sources, organize your data systematically—using tools like spreadsheets or dedicated software—to track relevant metrics such as price movements, trading volume, and market cap.
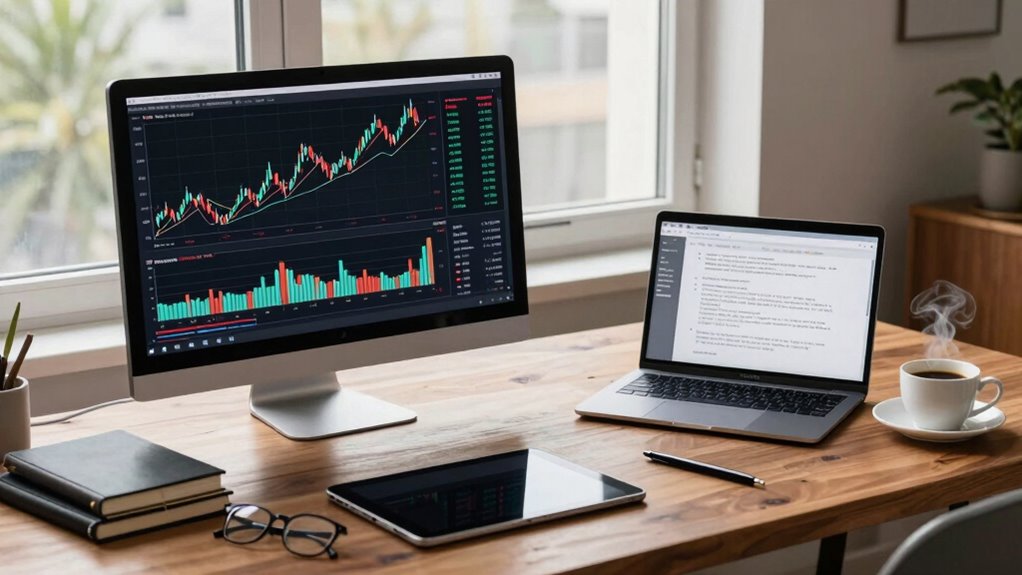
Develop a clear process for gathering, analyzing, and visualizing crypto data to stay ahead in a volatile market.
Market analysis is at the core of your research workflow. You need to evaluate current trends, identify patterns, and anticipate potential shifts. To do this effectively, break down your analysis into technical and fundamental aspects. Technical analysis involves studying historical price data and volume to spot trends using charts and indicators. Fundamental analysis, on the other hand, requires examining project fundamentals, team credibility, technological developments, and broader economic factors. Combining both approaches gives you a more comprehensive view of the market. As you analyze data, look for signals that indicate bullish or bearish momentum, but always validate your findings with multiple sources to avoid false signals. Incorporating data visualization techniques enhances your ability to interpret complex datasets quickly and accurately.
Data visualization plays a pivotal role in making sense of complex information. Instead of sifting through raw numbers, leverage charts, heatmaps, and dashboards to spot insights instantly. Visual tools help you recognize patterns that might be hidden in raw data, such as volume spikes, price divergence, or resistance levels. They also improve your ability to communicate findings if you’re sharing research with others. Choose visualization tools that integrate with your data sources—platforms like TradingView, CoinGecko, or custom dashboards built with data visualization libraries. Keep your visuals simple yet informative, focusing on clarity to make rapid decisions.
To build a better workflow, establish routines for regular review and adjustment. Dedicate specific times each day to scan your data, update your visualizations, and refine your analysis based on new information. Automate repetitive tasks whenever possible, such as data collection or alert notifications. Over time, refine your process by identifying which sources and visuals give you the most actionable insights. With a disciplined approach to market analysis and effective use of data visualization, you’ll be able to navigate the volatile crypto landscape with confidence, making smarter, faster decisions that keep you ahead of the curve.

Electronic Display for Real-Time Cryptocurrency/Bitcoin/Stock Market Data, Time, Weather & Temperature, 164*28*65mm, Supports Image Upload and 30s Video Playback, App-Controlled, 960*360 Resolution
- Real-Time Data Display: Displays live cryptocurrency, stock, weather, and time
- Custom Media Uploads: Supports personalized images and 30s videos
- App-Controlled Management: Easily control via dedicated app
As an affiliate, we earn on qualifying purchases.
As an affiliate, we earn on qualifying purchases.
Frequently Asked Questions
How Often Should I Review My Crypto Research Process?
You should review your crypto research process regularly, ideally every 2 to 4 weeks, to guarantee it stays effective. Adjust your research frequency based on market volatility and personal goals. During your process review, evaluate what’s working, identify gaps, and refine your methods. Consistent reviews help you stay current, adapt to market changes, and improve your decision-making, making your crypto research more accurate and reliable over time.
What Tools Are Essential for Effective Crypto Research?
You might think you need fancy tools, but essential ones include platforms for cryptocurrency analysis like CoinGecko or Glassnode, which provide real-time market data. Blockchain explorers such as Etherscan help you analyze blockchain data directly. Use news aggregators like CryptoPanic to stay updated, and consider data visualization tools like TradingView for insightful charts. These tools streamline your research, making it easier to make informed crypto decisions efficiently.
How Can I Identify Reliable Crypto Information Sources?
To identify reliable crypto information sources, focus on those that emphasize fundamental analysis and transparent data. Look for reputable sites, official project channels, and expert insights with proven track records. Cross-check information from multiple sources to verify accuracy. Incorporate risk management by avoiding overly optimistic or biased reports, and prioritize sources that provide balanced, well-researched analysis. This approach helps you make informed decisions and reduces exposure to misinformation.
What Are Common Pitfalls in Crypto Research Workflows?
Did you know that over 60% of crypto research errors stem from poor data validation and bias? Common pitfalls include relying on unverified sources, neglecting bias mitigation, and ignoring data quality. You might also fall into the trap of confirmation bias or overlooking market manipulation signals. To improve, always cross-check information, validate your data sources rigorously, and stay aware of your biases to make smarter, more informed decisions.
How Do I Stay Updated With Rapidly Changing Crypto Trends?
To stay updated with rapidly changing crypto trends, you should regularly monitor technical analysis charts and tools to catch market shifts early. Follow trusted crypto news sources and social media channels to gauge market sentiment, which can provide insights into investor behavior. Join relevant communities and forums to discuss trends and get real-time updates. This approach helps you adapt your strategies quickly and stay ahead in the fast-paced crypto world.

Crypto Seed Cold Storage Wallet with Engraver Pen Kit – Metal Plate and Etching Tool for Cryptocurrency Password Phrase Backup and Recovery
- All-Inclusive Crypto Storage Kit: Includes steel plate and engraving pen
- High-Quality Engraving Tool: Tungsten steel engraving pen for durability
- Fireproof and Waterproof Plate: Resists heat, water, and hacking attempts
As an affiliate, we earn on qualifying purchases.
As an affiliate, we earn on qualifying purchases.
Conclusion
Now that you’ve laid the foundation for a stronger crypto research workflow, you’re ready to uncover insights others might miss. But remember, the crypto world never stands still—new opportunities, risks, and trends emerge every day. Are you prepared to adapt and stay ahead? Keep refining your approach, stay curious, and watch as your research reveal secrets that could shape your next big move. The next breakthrough could be just around the corner—are you ready to find it?

AI Altcoin Alert System: Build Automated Crypto Research Workflows Using Telegram Bots, TradingView Alerts, and Sentiment Tools.
As an affiliate, we earn on qualifying purchases.
As an affiliate, we earn on qualifying purchases.

CRYPTO TECHNICAL ANALYSIS FOR BEGINNERS : Master Chart Reading, Identify Winning Setups, and Build Confidence in the Crypto Market—Even If You’re Starting from Scratch
As an affiliate, we earn on qualifying purchases.
As an affiliate, we earn on qualifying purchases.