A candlestick is a powerful tool used in trading to visualize price movements over time. Each candlestick consists of a body and wicks, showing the opening, closing, high, and low prices for a specific period. The body's color reflects market sentiment—green or hollow for bullish and red or filled for bearish. Traders analyze candlestick patterns to gauge buying or selling pressure and identify potential trend reversals or continuations. While candlestick charts provide valuable insights, they can also be subjective and lead to false signals. There's much more to explore about these patterns and how they can enhance your trading skills.
Key Takeaways
- A candlestick is a graphical representation of price movement over a specific time period in financial markets.
- Each candlestick consists of a body and wicks, indicating opening, closing, high, and low prices.
- The color of the candlestick body reflects market sentiment: green for bullish and red for bearish.
- Candlestick patterns help traders analyze price trends and emotional sentiment in the market.
- They are widely used due to their detailed information and effectiveness across various timeframes and securities.
Top picks for "candlestick"
Open Amazon search results for this keyword.
As an affiliate, we earn on qualifying purchases.
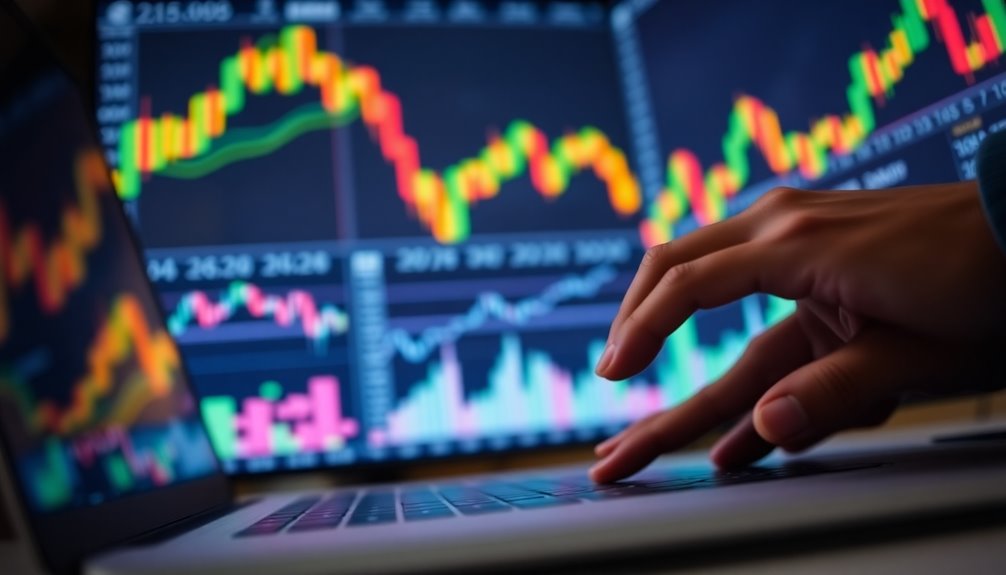
Candlestick Chart Fundamentals

Candlestick charts are essential tools in financial analysis, providing a visual representation of price movements over time.
Each candlestick consists of a body and shadows. The body shows the price range between the opening and closing prices—hollow or green if the stock closed higher, filled or red if it closed lower. The wicks indicate the high and low prices within that period. Candlestick charts originated in Japan in the 18th century and have since become a fundamental method for analyzing market trends.
You'll notice that the high is marked by the upper shadow's top, while the low is at the lower shadow's bottom. Understanding these components helps you interpret market sentiment.
Basics of Candlestick Charts
Understanding the basics of candlestick charts is crucial for any trader looking to interpret market movements effectively. Each candlestick represents a specific time period and consists of a body and wicks. The body indicates the range between the opening and closing prices, while the wicks show the highest and lowest prices during that time. You'll notice the body can be colored differently: green or white if the closing price is higher than the opening price, and red or black if it's lower. This color coding helps convey market sentiment. By recognizing patterns in candlestick charts, you can analyze price direction and trader emotions, aiding in your decision-making process. Moreover, the techniques evolved over time for modern financial markets, enhancing their reliability and relevance.
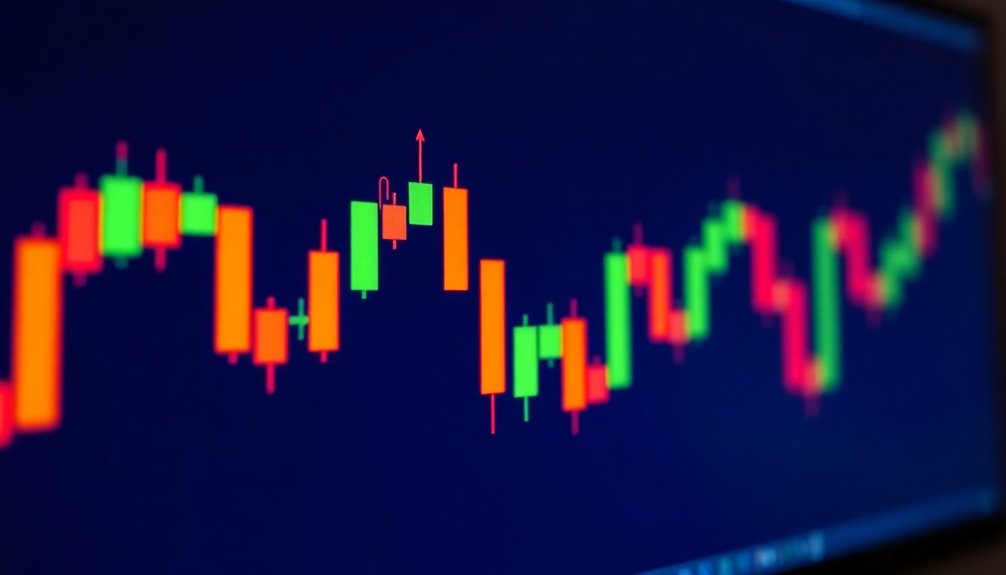
Interpreting Price Movement Signals
Price movement signals are essential for making informed trading decisions. Understanding the candlestick components, like the real body, wicks, and colors, helps you gauge market sentiment. A long real body indicates strong buying or selling pressure, while a short one reflects indecision. Furthermore, analyzing high and low prices can provide additional context on price fluctuations during the trading period.
Candlestick colors—green for bullish and red for bearish—also play a crucial role. Identifying reversal patterns, such as bullish engulfing or hammer formations, can signal potential trend changes.
Continuation patterns, like Mat Hold candlesticks, suggest that trends may persist. Finally, analyzing indecision signals like Doji or Spinning Top candlesticks helps you recognize when the market might shift direction.
Pros and Cons Overview

When evaluating trading strategies, weighing the pros and cons of candlestick charts is crucial.
On the pro side, they're easy to read and visually represent price movements, showing trends and key levels at a glance. Each candlestick provides comprehensive data, making them versatile for any timeframe or security. They're also great educational tools, helping you understand market sentiment and improve your trading strategies. The superior detail offered by candlestick charts enhances traders' ability to analyze price action effectively.
However, the cons include subjective interpretation, as different traders may see the same patterns differently. In volatile or sideways markets, they can be less reliable, and false signals may lead to poor decisions.
Additionally, candlestick charts focus mainly on price data, often requiring support from other indicators for better context.
Candlestick vs. Line Charts

While both candlestick and line charts serve as essential tools in trading, they cater to different analytical needs and preferences.
Candlestick charts offer detailed data, displaying opening, closing, high, and low prices, making them ideal for short-term analysis. Each candle's color conveys market sentiment, and various patterns can signal potential trend reversals. Additionally, the structure of candlestick charts provides insights into price movements that are crucial for technical analysis.
On the other hand, line charts simplify information by connecting only closing prices, providing a clearer view of long-term trends. They help you identify support and resistance levels but lack the detail found in candlestick charts.
Many traders find that combining both chart types enhances their analysis, allowing for a more comprehensive understanding of market dynamics.
Choose the one that suits your trading style best!
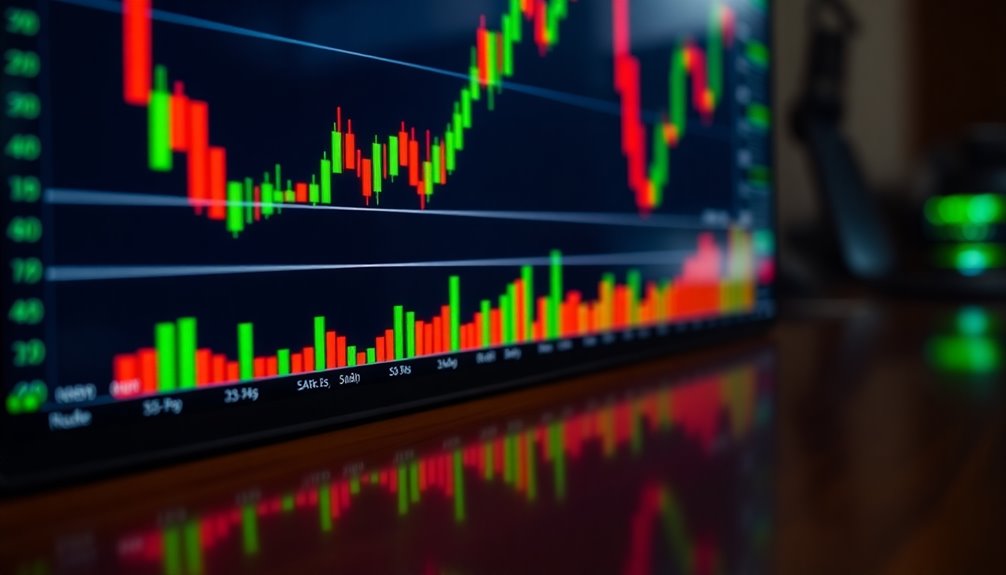
Market Volatility Impacts Accuracy
Market volatility significantly affects the accuracy of candlestick patterns, making it vital for traders to be aware of current conditions.
In highly volatile markets, price movements can become erratic, leading to false signals and unreliable patterns. While you might see more candlestick formations, not all are significant or trustworthy.
For instance, patterns like the bullish engulfing or morning star may lose predictive power when formed during turbulent times. Low liquidity can exacerbate this issue, resulting in even larger price swings. To increase reliability, consider combining candlestick analysis with other indicators like moving averages or volume data. This way, you can better assess the context and improve your trading decisions amidst volatility. Moreover, the subjective nature of interpretation can lead to varying conclusions among traders, further complicating decision-making in tumultuous times.
Emerging AI Trading Tools

Emerging AI trading tools are revolutionizing the way traders approach the market, offering innovative solutions to enhance efficiency and decision-making.
With platforms like Trade Ideas and TrendSpider, you can automate your trading using advanced algorithms and predefined rules, reducing emotional biases. AI trading signals generated by these tools provide real-time day trading opportunities, allowing for quick decision-making.
Tools such as TradingView and MetaTrader 5 streamline the trading process by enabling algorithmic strategies and copy trading, allowing you to follow successful traders effortlessly.
Moreover, these platforms provide powerful data analysis capabilities, helping you identify patterns and make informed decisions.
Customization options let you tailor your trading experience, while risk management features ensure your strategies are viable.
Identify Key Reversal Patterns
Identifying key reversal patterns is essential for traders looking to spot potential changes in market direction.
Bullish patterns, like the Hammer and Inverted Hammer, show buyers regaining control after a downtrend, while the Piercing Line and Morning Star provide stronger confirmation of a reversal. Recognizing these patterns is crucial as they suggest a loss of momentum in current trends, signaling entry and exit opportunities for traders.
Conversely, bearish patterns, such as the Hanging Man and Shooting Star, indicate that sellers are taking over after an uptrend.
The Dark Cloud Cover and Three Black Crows emphasize this shift with clear signals of downward momentum.
Always remember to look for confirmation candles and volume to validate these patterns.
Recognizing these key reversal patterns can significantly enhance your trading strategy and decision-making process.
Frequently Asked Questions
How Do Candlestick Patterns Differ Across Various Markets?
Candlestick patterns differ across various markets primarily due to the underlying asset's behavior and market conditions.
In stocks, you might notice patterns influenced by earnings reports, while forex patterns often reflect geopolitical events.
Commodities may exhibit patterns tied to supply and demand shifts.
Each market's unique characteristics can affect pattern reliability, so you should always consider the specific context when analyzing these patterns to enhance your trading decisions.
Can Candlestick Charts Be Used for Long-Term Investing?
Yes, you can definitely use candlestick charts for long-term investing. Their patterns remain consistent across time frames, helping you identify potential trend changes and reversals.
By recognizing bullish reversal patterns, like the hammer or morning star, you can adjust your investment strategies accordingly.
Combining candlestick analysis with other tools, like RSI or volume data, also enhances your decision-making process, making it easier to pinpoint entry and exit points for long-term gains.
What Software or Tools Are Best for Creating Candlestick Charts?
When you're looking to create candlestick charts, several tools stand out. amCharts simplifies the process with its 'CandlestickSeries' in an 'XYChart'.
Highcharts lets you customize colors and offers detailed API references. Koyfin provides extensive charting options and a vast indicator library, while TrendSpider automates pattern recognition, making analysis easier.
Each tool has unique features, so you can choose based on your specific needs and preferences for charting and analysis.
Are There Specific Candlestick Patterns for Cryptocurrencies?
Yes, there are specific candlestick patterns for cryptocurrencies that can help you identify potential market movements.
Patterns like the Hammer, Inverted Hammer, and Doji are common, signaling possible reversals or indecision.
The Three White Soldiers and Bullish Harami indicate strong buying pressure.
Always look for these patterns at significant support or resistance levels, and consider using additional indicators to confirm your trading decisions for more reliable outcomes.
How Do Traders Combine Candlestick Charts With Other Analysis Methods?
Traders combine candlestick charts with various analysis methods to enhance their decision-making.
You might use moving averages to identify trends and confirm reversals alongside candlestick patterns. Oscillators like RSI can signal overbought or oversold conditions, providing additional context.
Volume analysis helps assess the strength of moves indicated by candlesticks, while integrating multiple time frames offers a broader market perspective.
This comprehensive approach increases the accuracy of your trading signals and strategies.
Conclusion
In the world of trading, understanding candlestick charts is like having a superpower that can unlock the mysteries of price movements. By mastering their fundamentals, you can spot trends and reversal patterns, giving you an edge over the market. While they come with pros and cons, their insights are invaluable, especially when combined with emerging AI tools. So dive in, embrace the candlestick magic, and watch as your trading strategy transforms into a powerhouse of success!