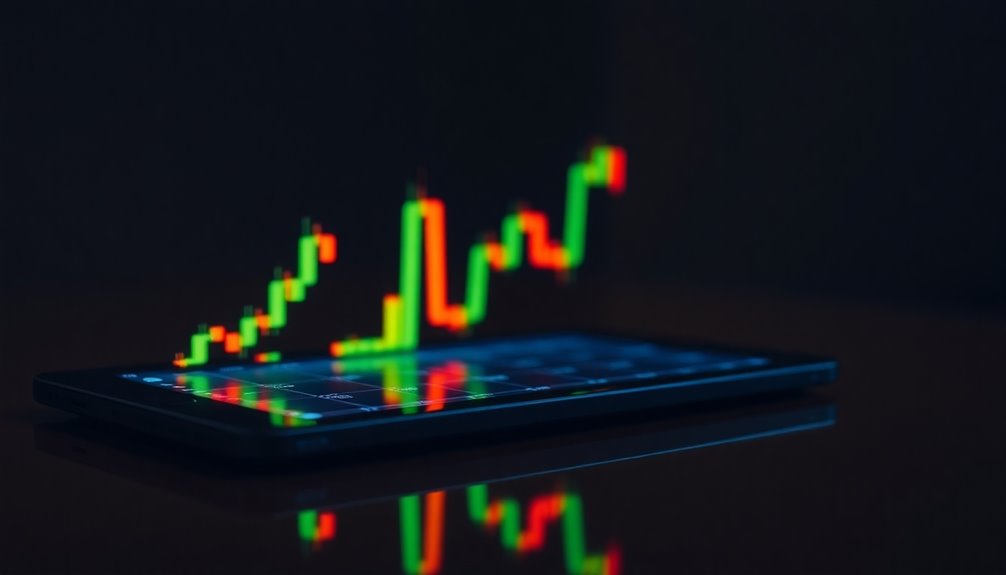

A hammer candlestick is a key indicator that signals potential bullish reversals after a downtrend. You'll notice it has a small body at the top and a long lower shadow, which shows strong buying pressure. Ideally, it features little to no upper shadow, hinting at sustained momentum from buyers. It's important to see a confirmation – like an upward candle closing above the hammer's high – to validate the signal. Using it alongside other technical indicators or in key support zones enhances its reliability. Keep exploring, and you might uncover more insights about this essential trading tool.
Key Takeaways
- A hammer candlestick indicates potential bullish reversals following a downtrend, characterized by a small real body and a long lower shadow.
- The long lower shadow, at least twice the body's length, reflects strong buying pressure and suggests a shift in market sentiment.
- Confirmation of the reversal requires an upward candle closing above the hammer's high, ideally accompanied by high trading volume.
- Hammer patterns are more reliable when found in key support zones, though they should not be used in isolation.
- Traders should be cautious of false signals and market volatility, emphasizing the need for additional analysis and risk management.
Characteristics and Formation

The hammer candlestick is a powerful pattern that signals potential bullish reversals in a downtrend. It features a small real body located at the top of the trading range, indicating indecision between buyers and sellers.
You'll notice it can be either green or red, with green being slightly more bullish. The long lower shadow, at least twice the body's length, shows that the price dropped significantly before rallying back near the open, reflecting intense selling overcome by buying pressure.
Ideally, the hammer has little to no upper shadow, signaling sustained buying pressure. For validity, it forms at the bottom of a downtrend, ideally with increased volume or at support levels, suggesting the exhaustion of selling momentum. Additionally, multiple consecutive hammers can enhance the reliability of the reversal signal.
Candlestick Pattern Overview
Candlestick patterns serve as essential tools for traders, providing insights into potential price movements and market sentiment.
These patterns can be categorized into bullish and bearish types. Bullish patterns, like the Hammer and Bullish Engulfing, signal that buyers are gaining control, often occurring after a downtrend.
Each candlestick comprises key components: open, close, high, and low prices, with the body and shadows conveying market sentiment. The color of the body indicates bullish (white/green) or bearish (black/red) tendencies, while the length of the body and shadows offers additional insights. Understanding these elements helps you interpret market direction and potential price movements effectively.
Additionally, candlestick patterns are integral to technical analysis and have been used since the 18th century.
Always remember to consider patterns within the overall trend context for accurate analysis.
Price Reversal Indication
A Hammer candlestick often signals a potential bullish reversal, particularly when it forms after a downtrend.
This pattern features a small body at the upper end of the trading range and a long lower shadow, typically twice the length of the body, with little to no upper shadow.
It indicates a shift from selling pressure to buying pressure, showing that buyers have regained control by the end of the period.
The long lower shadow reflects that intraday selling was overwhelmed. Additionally, this pattern is essential for traders to understand market sentiment and price action.
To confirm this reversal, look for an upward candle that closes above the hammer's high.
High trading volume and positive momentum indicators can further validate the signal, ensuring you're making informed trading decisions.
Pros and Cons Overview
While exploring the pros and cons of the Hammer candlestick pattern, you'll find that it offers valuable insights for traders seeking potential bullish reversals.
On the plus side, it signals trend reversals, highlights buying pressure, and provides clear entry points for long positions. It's versatile across various strategies and timeframes, making it a useful tool in your trading arsenal. The Hammer pattern resembles a hammer shape, which visually reinforces its significance in technical analysis.
However, be wary of its drawbacks. The Hammer can generate false signals and often requires confirmation from subsequent candlesticks. Its limited context means it shouldn't be used in isolation, and its reliability diminishes in volatile markets.
Understanding both sides is crucial for making informed trading decisions with this pattern.
Versus Other Candlestick Patterns
Understanding the Hammer candlestick pattern becomes even clearer when you compare it to other candlestick formations.
For instance, the Inverted Hammer has a long upper shadow and appears at the bottom of downtrends. In contrast, the Hanging Man signals potential bearish reversals at the top of uptrends.
While both the Hammer and Morning Star indicate bullish reversals, the Hammer is a single-candle pattern, unlike the three-candle Morning Star.
When considering Piercing Line and Engulfing Patterns, the Hammer stands out with its unique long lower shadow. This is important because the Hammer candlestick pattern is a key indicator that buyers regain control after significant selling, making it a powerful tool in your trading arsenal.
Each of these patterns provides distinct insights, but the Hammer highlights a moment where buyers regain control after significant selling, making it a powerful tool in your trading arsenal.
Market Volatility Impact
When market volatility is high, the Hammer candlestick pattern often emerges as a powerful indicator of potential reversals. You'll notice it forms at the bottom of a downtrend, characterized by a small body and a long lower wick. This pattern signals a shift from selling to buying pressure, often near key support zones. The long lower shadow shows intraday price volatility, as sellers initially push prices down, but buyers quickly bid the price back up. A lack of an upper shadow confirms the reversal, while high trading volume validates the signal. It's crucial to wait for confirmation from subsequent market movements before acting, as this can significantly impact your trading success in volatile conditions. Additionally, the effectiveness of a hammer candlestick relies on the preceding market conditions, emphasizing the importance of context in trading decisions.
Recent Market Sentiment Shifts
As recent economic indicators suggest a more optimistic outlook, market sentiment is shifting towards a cautious yet hopeful stance.
You might notice that U.S. growth is projected at 2% in 2025, fueled by cooling inflation and potential interest rate cuts. Business leaders are feeling more confident, with many not expecting a recession. Meanwhile, job creation continues to support economic resilience, reflecting a strong labor market.
However, global dynamics vary, with Europe struggling and China facing challenges. Elevated equity valuations mean investors need to stay alert for potential surprises.
Despite this, sectors like healthcare and industrials are thriving, presenting opportunities.
As the new administration's policies take shape, you can expect a boost in business confidence, even as trade tensions and regulatory changes introduce some volatility.
Stay informed and adaptable to navigate this shifting landscape.
Identify Strong Support Levels
Identifying strong support levels can significantly enhance your trading strategy by pinpointing areas where the price is likely to bounce back.
Look for key price points by observing where the price has bounced multiple times. Notable wick rejections and the Open, High, Low, Close (OHLC) prices from daily, weekly, or monthly candlesticks often highlight these levels.
Psychological numbers also serve as effective support. Strong support levels are marked by several touches, indicating buyer demand is robust enough to halt downward trends. Additionally, the more a level is tested, the stronger it is perceived as a reliable support level.
Remember, each successful test reinforces the support's strength, but over time, repeated tests might weaken it.
Lastly, candlestick patterns like hammers can signal potential support areas, suggesting buyers are regaining control.
Frequently Asked Questions
How Do Hammer Candlesticks Differ in Various Markets?
Hammer candlesticks can differ in various markets based on the underlying asset's volatility and trader sentiment.
In stocks, you might see clearer patterns due to higher trading volumes, while forex markets might present more rapid movements.
Commodities can show strong reactions at support or resistance levels.
Regardless of the market, always look for confirmation with follow-through candles to ensure the signal's reliability, and adjust your strategy accordingly.
Can Hammer Candlesticks Be Used in Day Trading?
Yes, you can definitely use hammer candlesticks in day trading. They signal potential trend reversals, especially after a downtrend, indicating that sellers might be losing strength.
When you spot a hammer, wait for confirmation with the next candle before entering a long position. Setting a stop-loss below the hammer's low helps manage risk.
Combine this pattern with other technical indicators for better results and to enhance your trading strategy.
What Timeframes Are Best for Analyzing Hammer Candlesticks?
They say, "Good things come to those who wait."
When analyzing hammer candlesticks, consider using daily and weekly timeframes for the best results. Daily charts offer a balance between volatility and reliability, helping you gauge market sentiment.
Meanwhile, weekly charts provide insights into long-term trends and significant reversals. Avoid relying solely on short timeframes, as they can lead to false signals.
Always match your chosen timeframe with your trading strategy for success.
Are Hammer Candlesticks Reliable in Low-Volume Markets?
Hammer candlesticks can be less reliable in low-volume markets.
When volume is low, the pattern may not accurately reflect buying pressure, making it tricky to trust the signal. You should look for confirmation from subsequent candles and consider combining the hammer with other technical indicators to enhance its reliability.
If you spot a hammer in low volume, be cautious, as it mightn't indicate a strong trend reversal.
How Can I Combine Hammer Candlesticks With Other Indicators?
Picture this: you're a trader on a wild west adventure, seeking treasure in the market.
You can combine hammer candlesticks with trend lines to spot entry and exit points, or use moving averages to confirm trends.
Oscillators help validate buying pressure, while Fibonacci retracements pinpoint key levels for entries.
Conclusion
So, while you might think the hammer candlestick is just a simple shape, it's actually a powerful tool in your trading arsenal. Picture this: a tiny hammer swings down, yet it's the very thing that builds your market strategies. It signals reversals when you least expect it, like a surprise party for your portfolio. Just remember, even the strongest hammers can get rusty, so keep an eye on market volatility and sentiment shifts to ensure your trades stay sharp.